Projects Marvel by Phase
Marvel by Phase
The MCU split into its phases and measured: budgets, box office, critic and audience scores, release cadence. Which phase was the golden age, which actors and writers made the studio the most money, and where the critics and the audience stopped agreeing.
- Stack
- R · ggplot2 · dplyr
The short version
I pulled 37 Marvel films into one table and measured them by phase: ratings from seven sources, production budgets, worldwide box office, and the gap between each release.
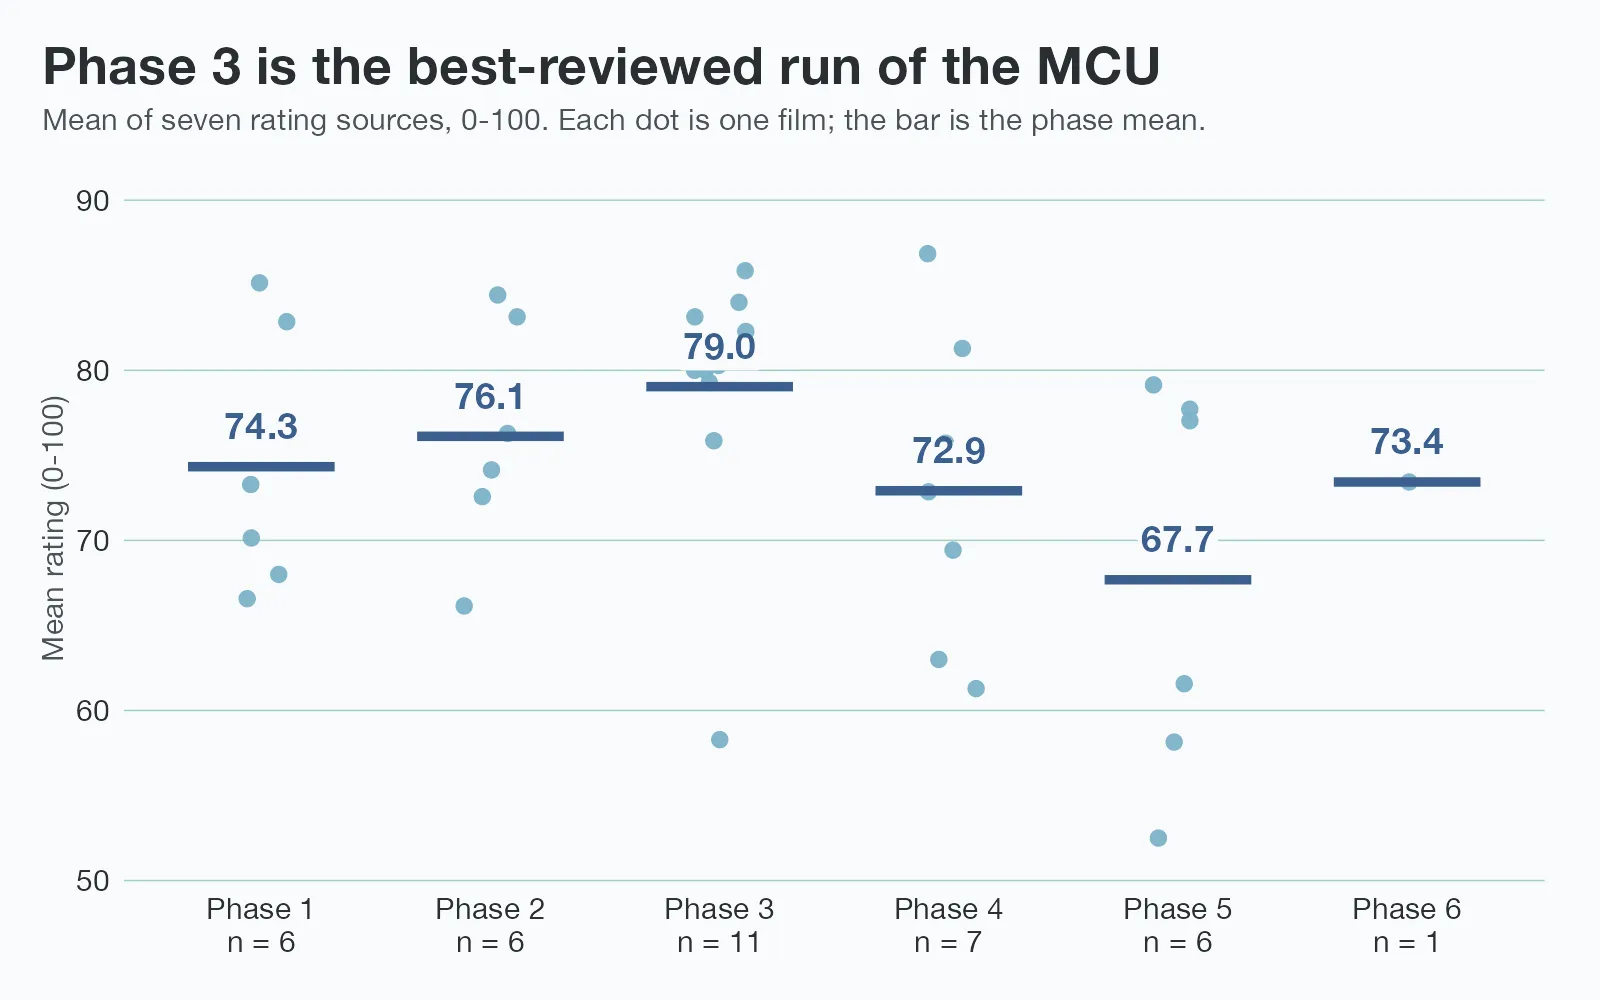
I have watched most of these in the cinema, and the widely held sense that Phase 3 was the good run holds up against the numbers. Phase 3 averages 79.0 out of 100 across its rating sources and $1,227M worldwide per film, and it leads on both. It is also the only full phase where critics scored the films higher than audiences did.
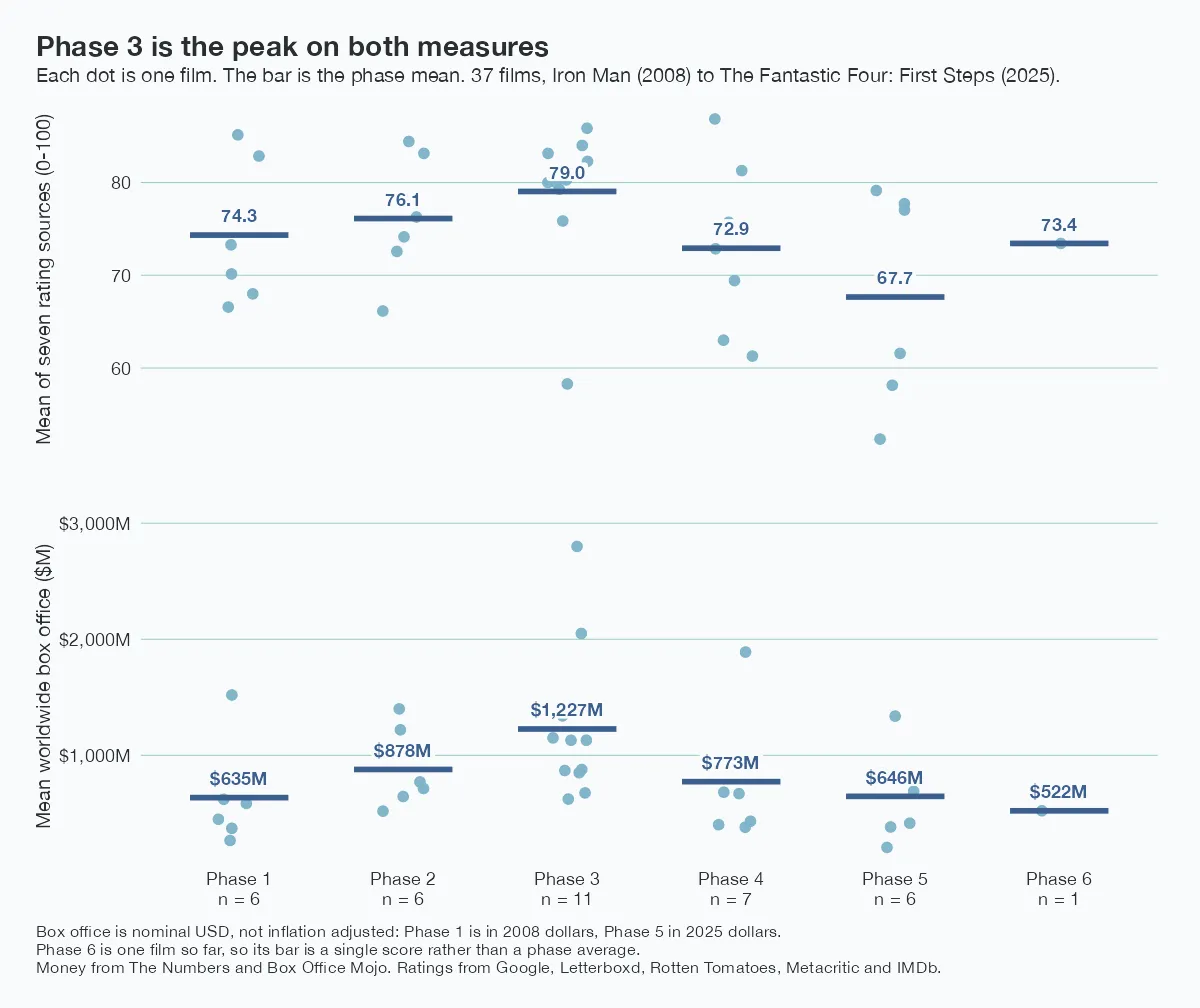
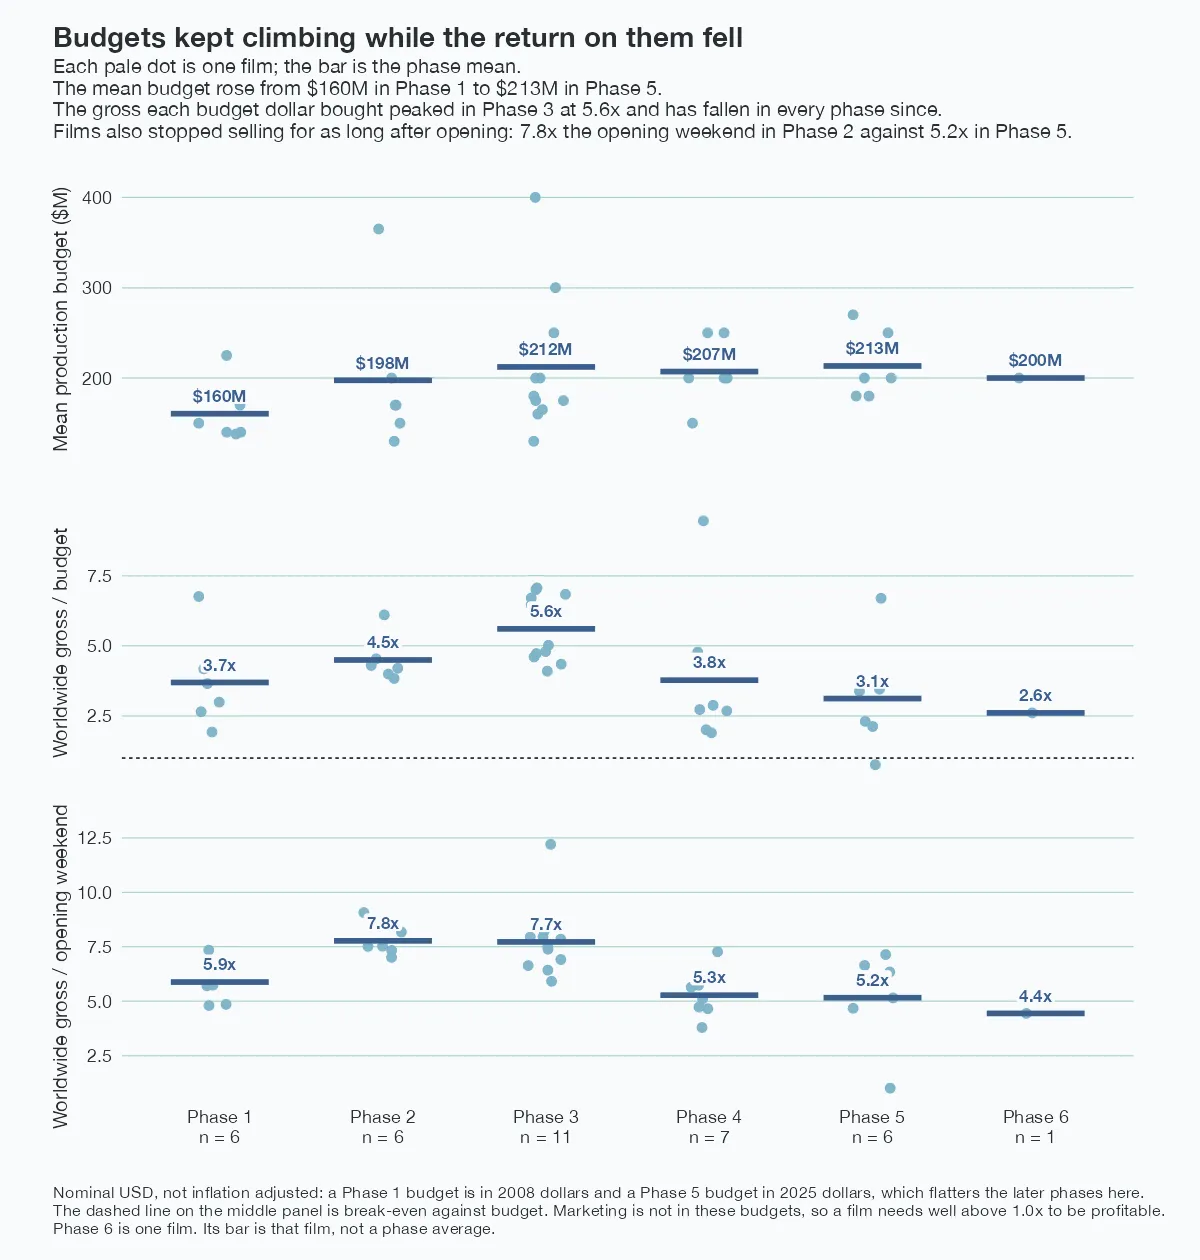
The honest caveat is that none of the box office is inflation-adjusted. Phase 1 is being compared in 2008 dollars against Phase 5 in 2025 dollars, and I did not apply an index.
The analysis repo is not public yet, so there is no code link on this page. Nothing is deployed either. The charts here are the current output, not a finished site.
How it works
The data began as two CSVs I made years ago and never put in version control: 34 films with 66 columns of ratings, budgets and box office, and a companion file with 332 columns of cast information. I copied both into a new repo and wrote four R scripts that carry them from raw to charts, so the fixes are reviewable rather than buried in a spreadsheet.
Six things were wrong.
Deadpool & Wolverine had been entered on a 0-10 scale for two of its seven rating columns. That dragged its average to 52.73 and made it read as the worst-received film Marvel has made. Corrected, it is 77.71. Guardians of the Galaxy Vol. 3 had a budget of 25,000,000 rather than 250,000,000. The franchise column called Wakanda Forever “Blank Panther”, splitting that franchise in two. The director column was scrambled for the last four films. Six columns of stored differences were empty on every row while a duplicate set held them.
The sixth was the largest. Nineteen of the 34 rows held another film’s cast. Thor’s row held Iron Man 3’s cast, and Doctor Strange’s held Black Panther’s. Four films had lost theirs entirely. The raw cast text on each row had never shifted, so I scored every film-against-block match against it. Four films I entered by hand.
I added the three films released since, and a writers column that did not exist in the original data. Both carry a source URL and a retrieval date of 9 September 2026.
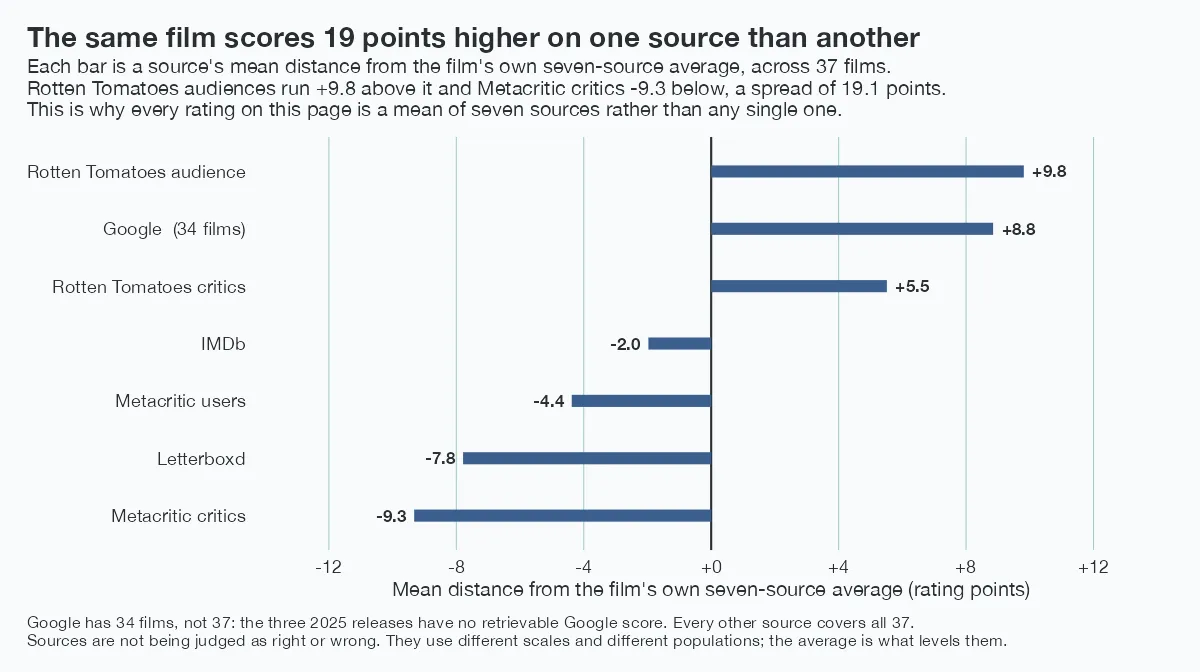
Every rating on this page is a mean of seven sources rather than any one of them. That is not a hedge. Measured against a film’s own average, Rotten Tomatoes audiences sit almost ten points above it and Metacritic critics nine points below, a spread of nineteen points on the same film.
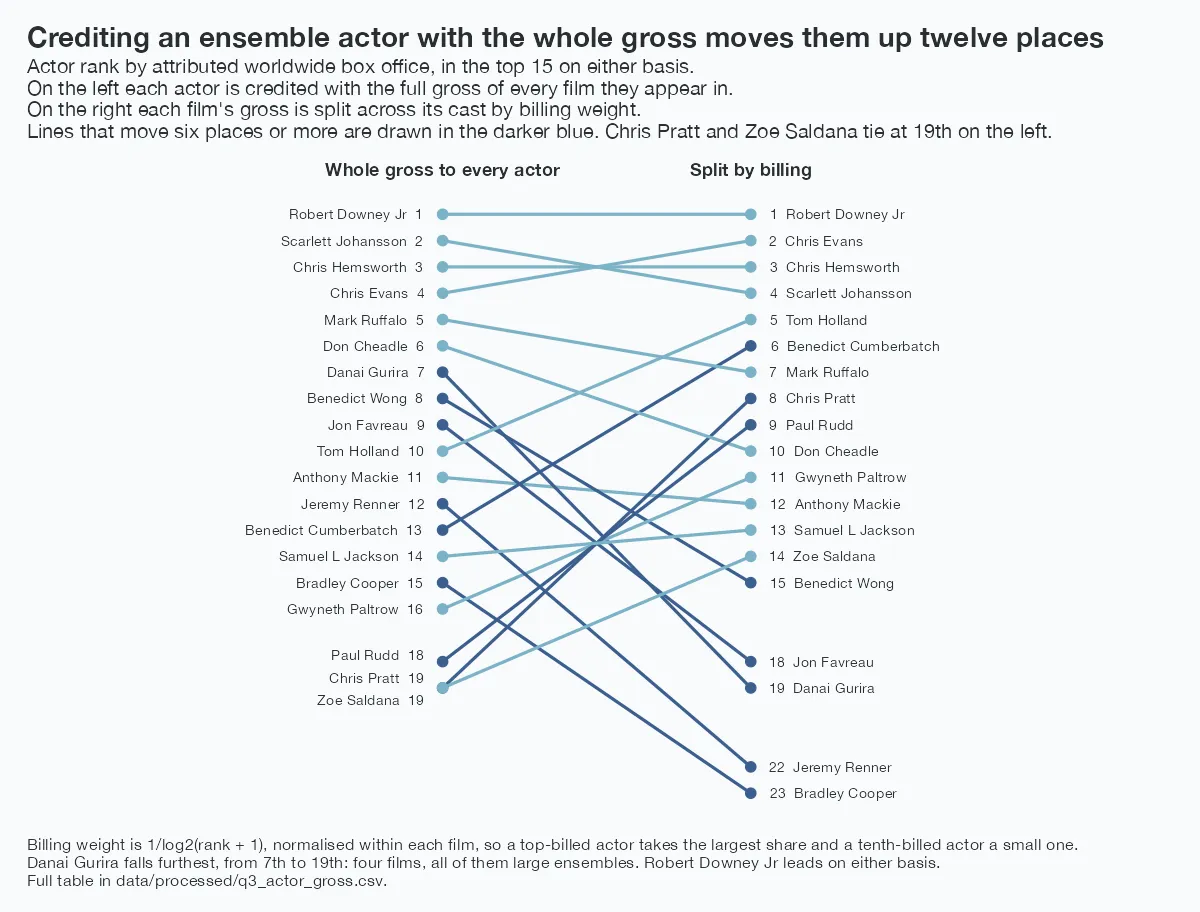
For the actor and writer rankings I split each film’s worldwide gross across its cast by billing weight, rather than crediting each of them with all of it. Robert Downey Jr leads either way, but the order under him moves: Danai Gurira is seventh unadjusted and nineteenth once an ensemble film counts only for a share.
The charts are ggplot2, with every film drawn as its own point behind its phase average, because Phase 5 has six films and Phase 6 has one.
What didn’t work
The old data carried a billed_stars column I had built as a star-power score, correlating with box office at 0.63. It is a function of cast-list length and nothing else: eleven distinct values for eleven distinct cast sizes. It knew how many people were billed and nothing about who. Cast size replaces it as a plain column.
The misalignment sat in the file for two years. The cast was stored as 310 one-hot columns, and in that shape a nineteen-row shift looks like ordinary sparse data. The rebuilt output is one row per actor per film, where it would have been obvious.
What the data says
Phase 3 is the peak on ratings and on gross. The phases either side of it are where the more interesting questions sit.
Budgets climbed through the run while the return on them did not. A Phase 3 film turned its budget into 5.6 times itself. A Phase 5 film managed 3.1. Films also stopped selling for as long after they opened.
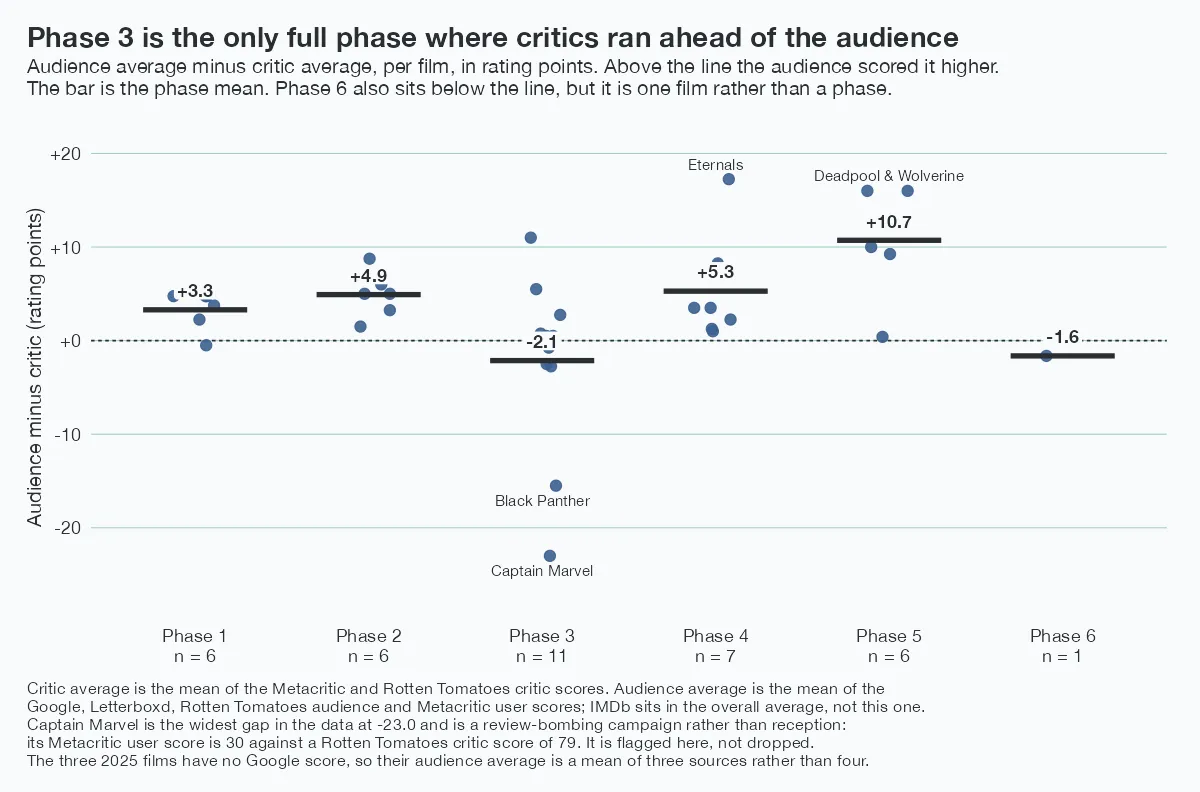
Critics and audiences agreed least in Phase 5, where audiences scored films nearly eleven points higher on average. Phase 3 is the only full phase that runs the other way; Phase 6 does too, on the strength of a single film. The widest single gap in the data is Captain Marvel at twenty-three points, which is a review-bombing campaign rather than a split in reception, and it is flagged rather than dropped.
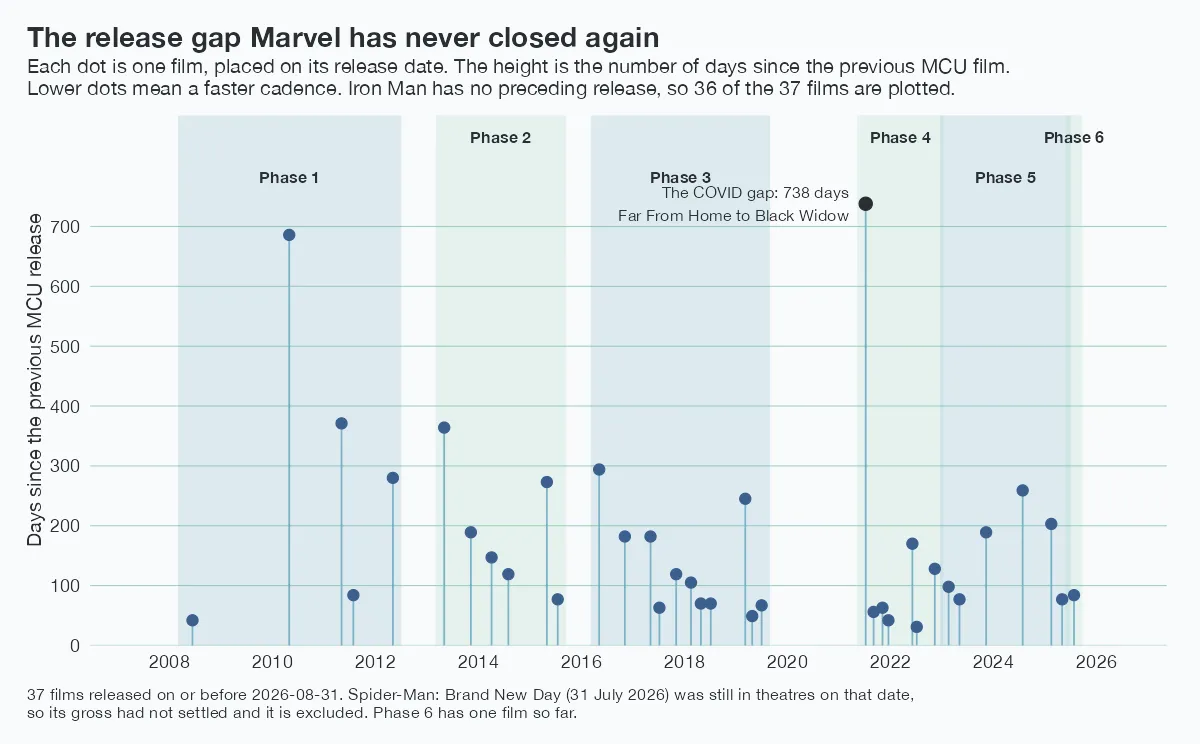
The release cadence explains some of what the ratings do. Phase 4 put out a film every sixty-three days at its median, the tightest run in the whole history, straight after the longest gap in it.
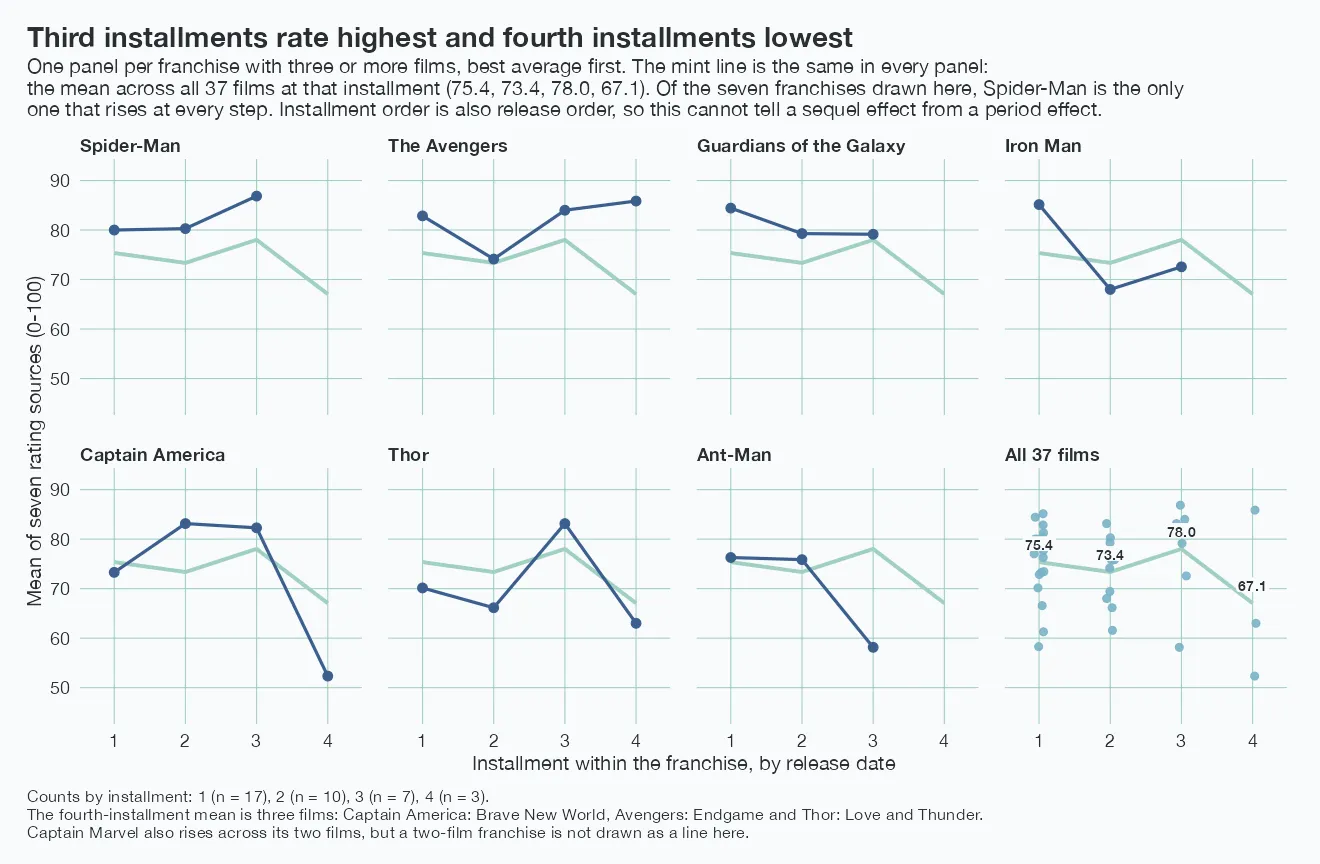
The sequel curve does not decline the way the received account says. Third installments rate highest and fourth installments lowest, and only one of the seven franchises drawn here improves at every step. Installment order is also release order, so none of this separates a sequel effect from the period a film came out in.
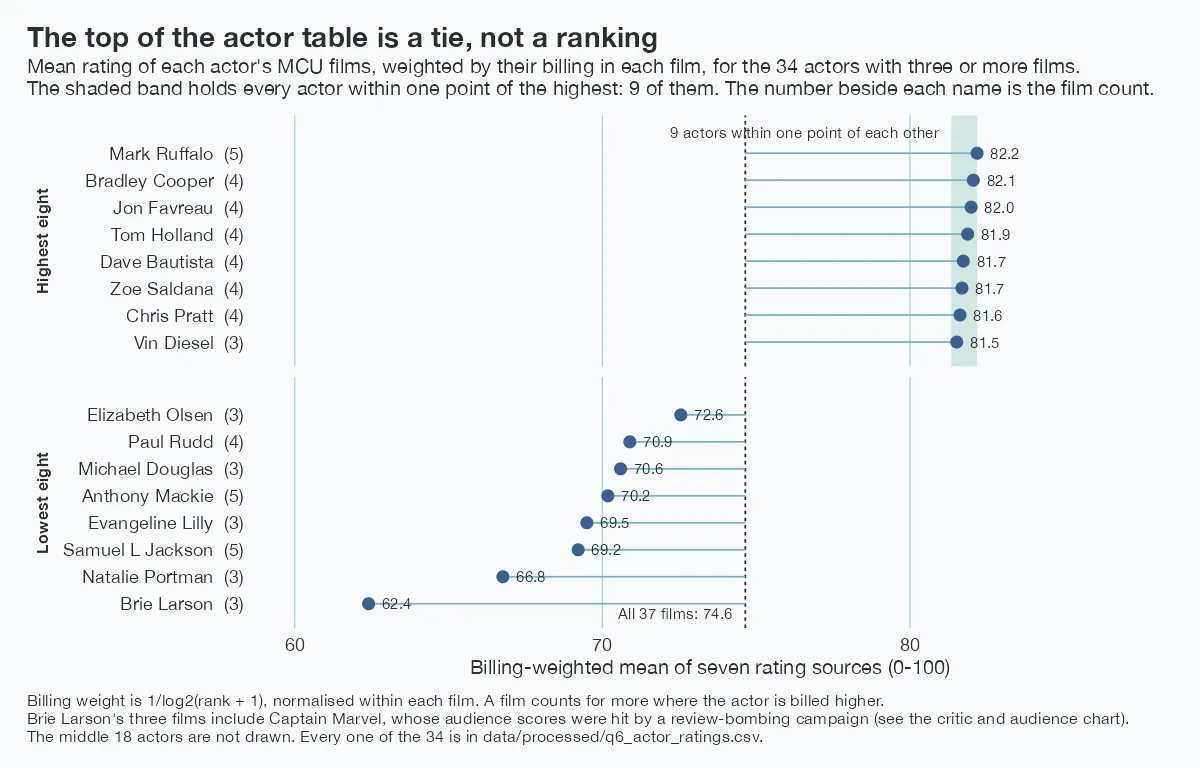
Splitting each film’s gross by billing weight also lets a rating be attributed the same way. The result is mostly a caution about reading the table too closely: nine of the thirty-four actors sit within a single point of each other at the top.
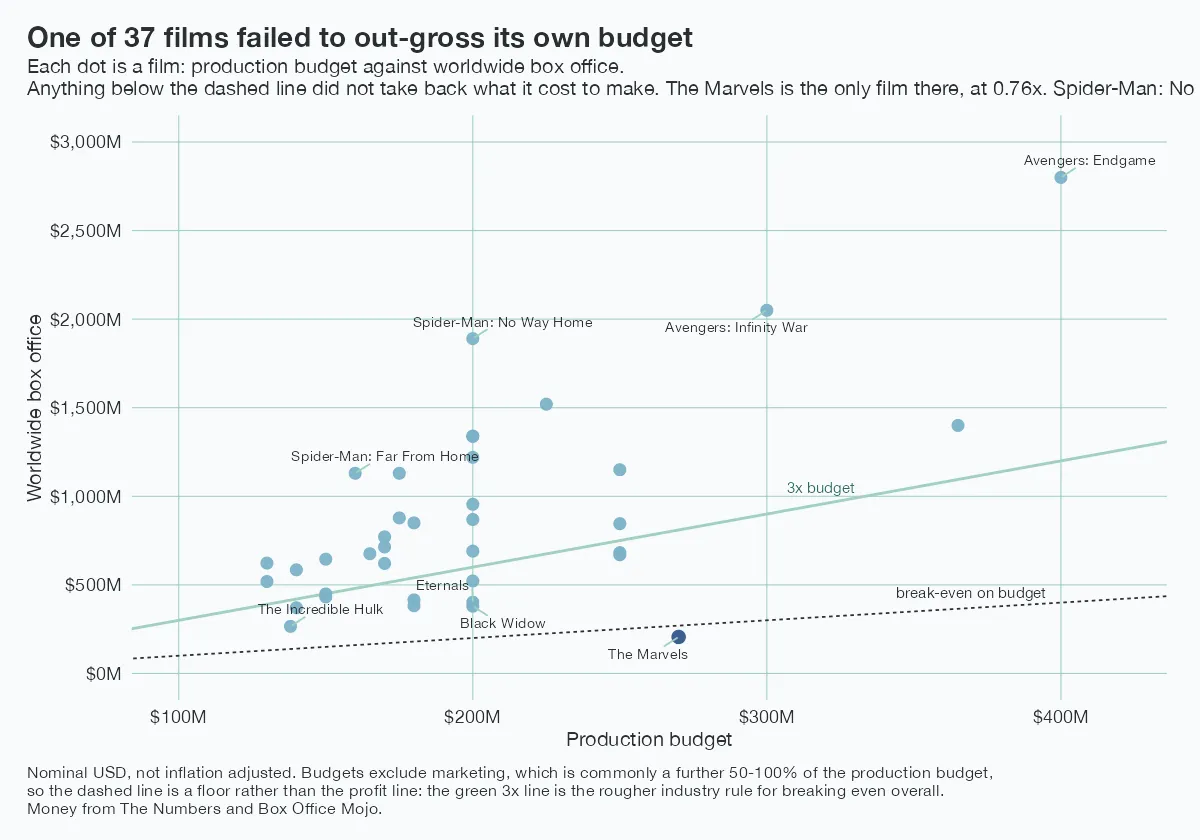
Only one film in thirty-seven failed to out-gross its own production budget. That is a lower bar than it sounds, because these budgets exclude marketing, which is commonly another half to a whole budget again.
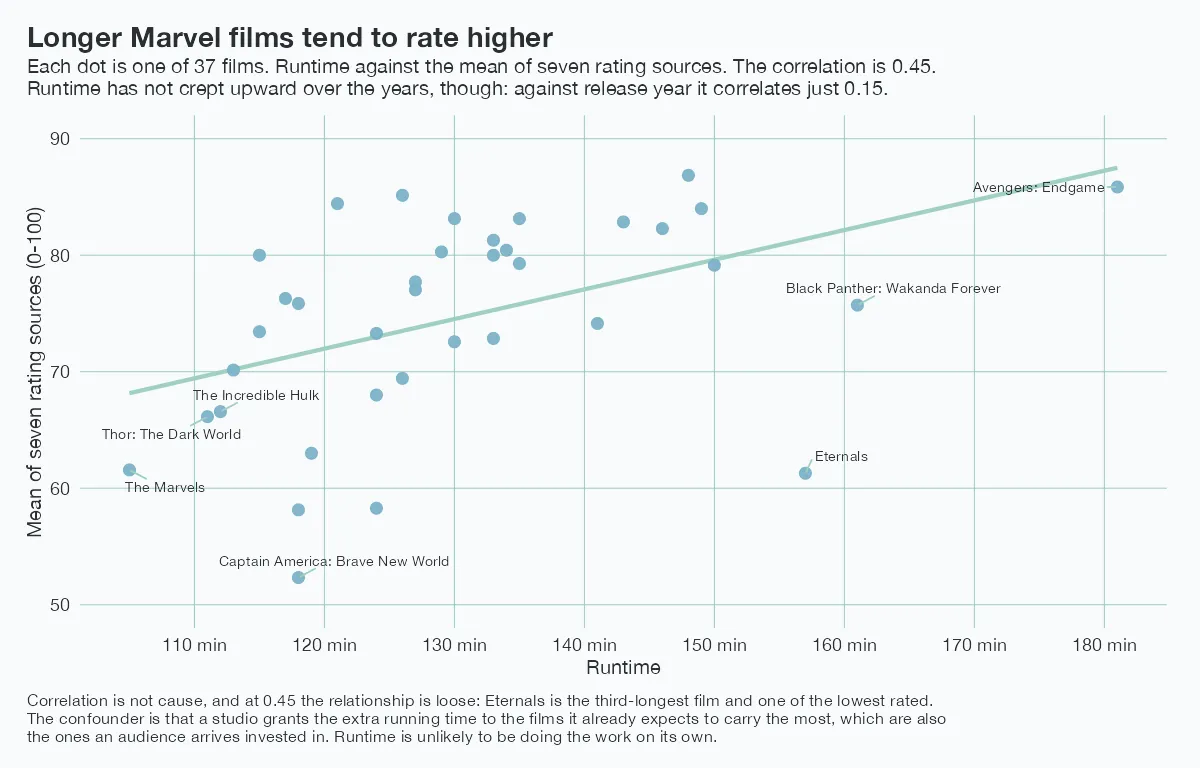
The longer films rate higher, at a correlation of 0.45. I do not think runtime is doing the work. A studio grants the extra running time to the films it already expects to carry the most, and those are the films an audience arrives invested in. Eternals is the third-longest film and one of the lowest rated.
The long version
This section is being written.