Projects Octagon IQ
Octagon IQ
The thesis data kept growing. Octagon IQ is where it ended up: a fight prediction model, a live site, and an audit that found five critical defects in my own features.
- Links
- octagon-iq.ie
- Stack
- TypeScript · Bun · Hono · SQLite · Drizzle · Python · scikit-learn · XGBoost · React
The short version
Octagon IQ is three things in one repository: a fight prediction model, a live analytics site at octagon-iq.ie, and the data audit that sits underneath both. The site carries fighter ratings, matchup breakdowns and round-by-round statistics for every UFC card. You can use it at octagon-iq.ie.
It grew out of my masters thesis data, which kept growing after the thesis was done. What I ended up caring about is the audit rather than the model. Six parallel audits over the transform code and the Python cleaning scripts turned up five critical defects in features I had written myself, and one of them moved information backwards through time.
The figures come from after those fixes. On a held-out test set the model reaches AUC 0.6991 and 64.8% accuracy, and cross-validated AUC is 0.640 ± 0.018.
The caveat, up front. That cross-validated band is the number I would defend, and it is a modest result honestly measured rather than a good one loosely measured. The single holdout figure is the flattering one and it sits on one split.
TypeScript on Bun with Hono, SQLite and Drizzle behind the site, Python with scikit-learn and XGBoost for the model, React on the front end. The site is live at octagon-iq.ie and I am still working on it.
How it works
Octagon IQ predicts the outcome of UFC fights from a fighter’s record, their ratings history and the shape of their recent form. The model running on the site is the one I call v10-clean. It uses 81 features, trimmed down from 147, drawn out of a raw pool of 173 across fifteen categories. The accuracy figures above are its held-out test scores, and the cross-validated band is five-fold.
The work I am most attached to sits under the model rather than in it.
In July 2026 I ran six parallel audits across the transform code and the Python cleaning scripts, about 11,400 lines in total. They turned up five critical defects. Every one of them was confirmed against the database before I touched anything.
The first was a labelling bug. The routine deciding which corner a fighter had fought in matched names by exact string only, and small spelling differences like “Zach” against “Zachary Reese” fell straight through it. Fifteen fights matched neither corner, and at least six credited the win to the wrong fighter. Those results then fed the Elo ratings, the fight snapshots and the training labels. The judges’ scorecards ran through the same comparison and flipped with them.
The second was a corner-orientation bug. Best-odds and line-movement features were attached to a fighter by their row order on the scrape page instead of by their corner. Across 7,115 fights, row index 1 landed on the red fighter 3,378 times and on the blue fighter 3,396 times, which is a coin flip. Roughly half of every sign-bearing feature in that group was noise.
The third was a run-order bug. Tier scores were computed before the Elo transform had populated the column those scores read from, leaving 70% of the weight sitting on an always-empty value. The whole range came out between exactly 0.35 and exactly 0.65, which is the shape a constant makes.
The fourth is the one I would properly call a leak. Features labelled “pre-UFC” were counting 12,067 non-UFC professional fights that happened after the fighter’s UFC debut, across 1,387 fighters. A fighter released in 2016 who went on to win eight in a row elsewhere had those later wins baked into his 2014 features.
The fifth was a duplication bug. SQLite treats NULLs as distinct inside a unique constraint, and the upsert on method-odds rows never fired for rows with a null fighter id. The table held 33,421 rows against 32,641 distinct keys, with some rows sitting there in sixteen identical copies, one per historical re-run.
Four of those five are ordinary data-quality faults: a bad join, a wrong orientation, a pipeline stage running too early, a constraint that did not constrain. Only the fourth moves information backwards through time.
I fixed all five and rebuilt the pipeline from the clean layer up. The figures at the top come from after the fixes, which is the only reason I trust them enough to publish.
One of the charts the site is built on is the age cliff: the age band in which each division’s average Elo change per fight crosses zero.
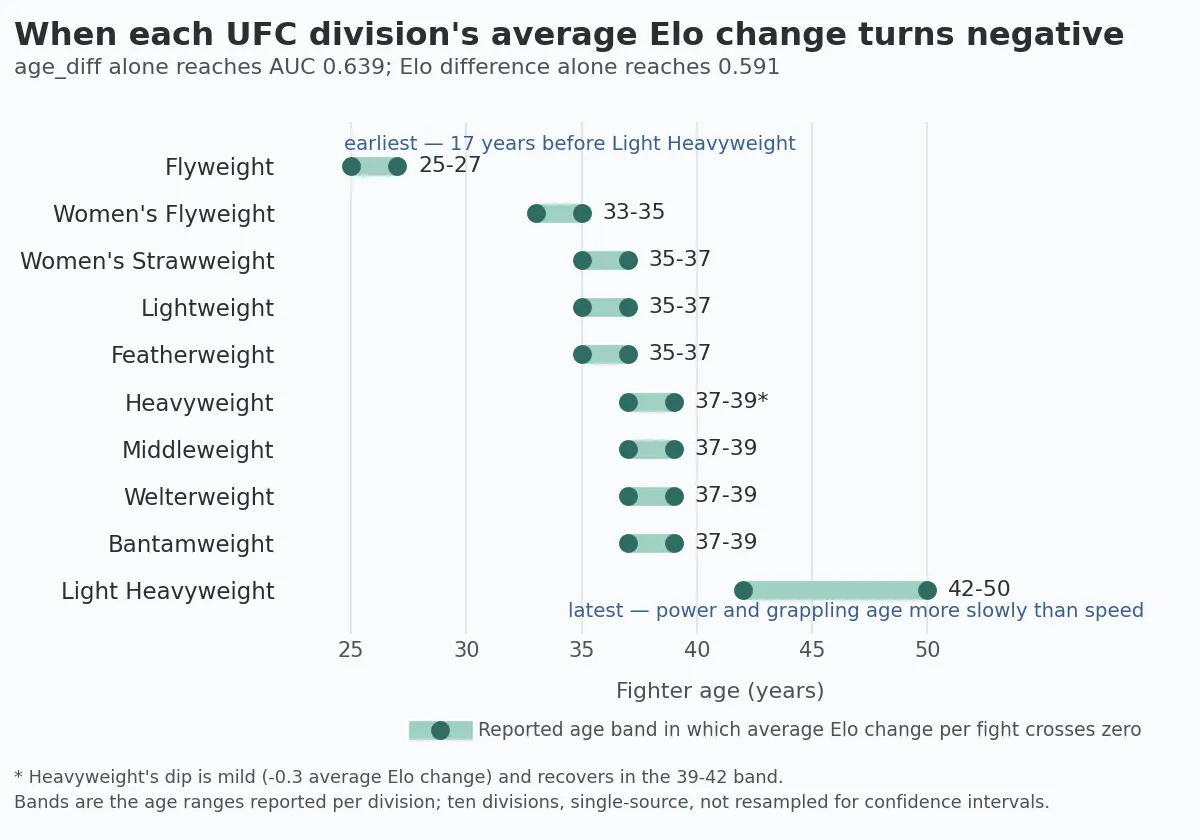
Speed-led divisions turn first and the heavier, grappling-led ones turn last. The footnote is on the chart because it belongs there: these bands come from one source and carry no confidence intervals, so the ordering is the finding and the exact ages are not.
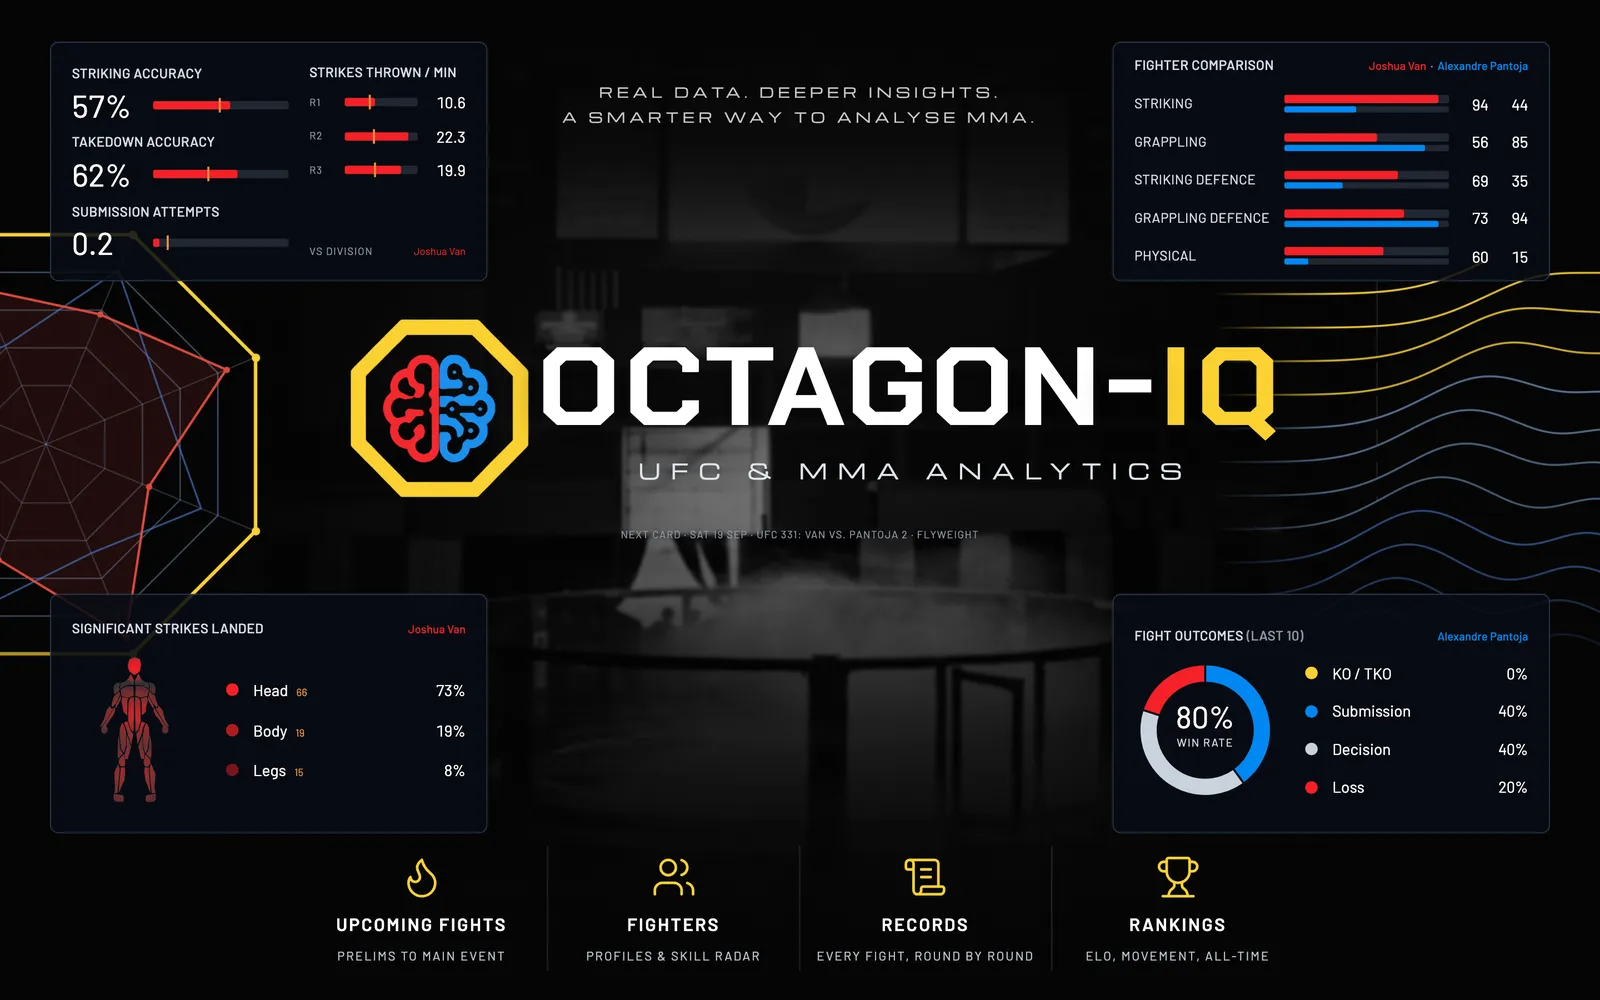
The image at the top of this page is the site’s landing page. It pulls the next UFC card and compares the two fighters in its main event. The art on either side is original, drawn to replace press photos the live site still uses until that change is deployed.
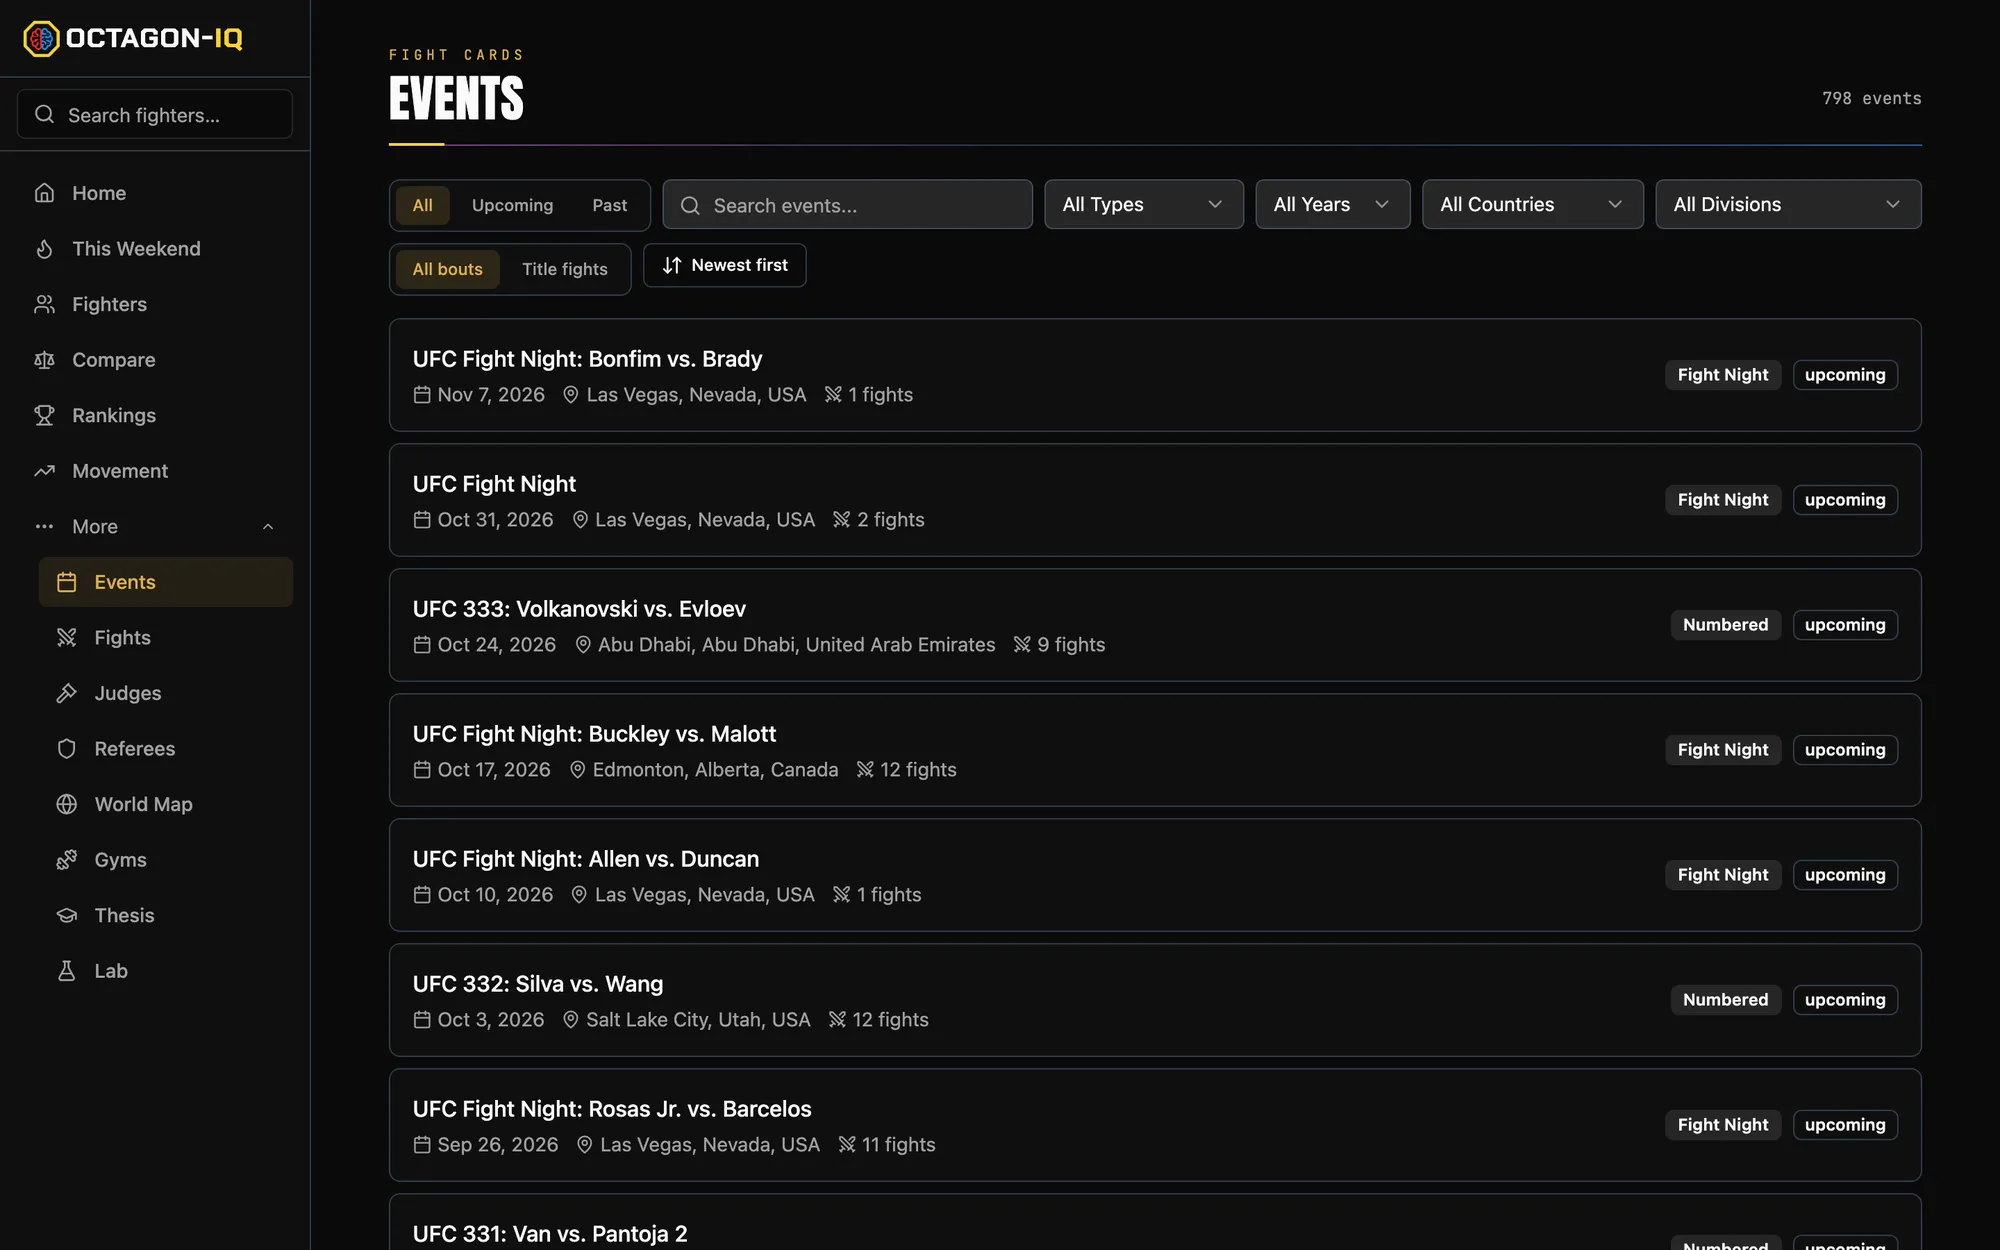
The Events page lists every card in the database, 798 of them, with filters for type, year, country and division.
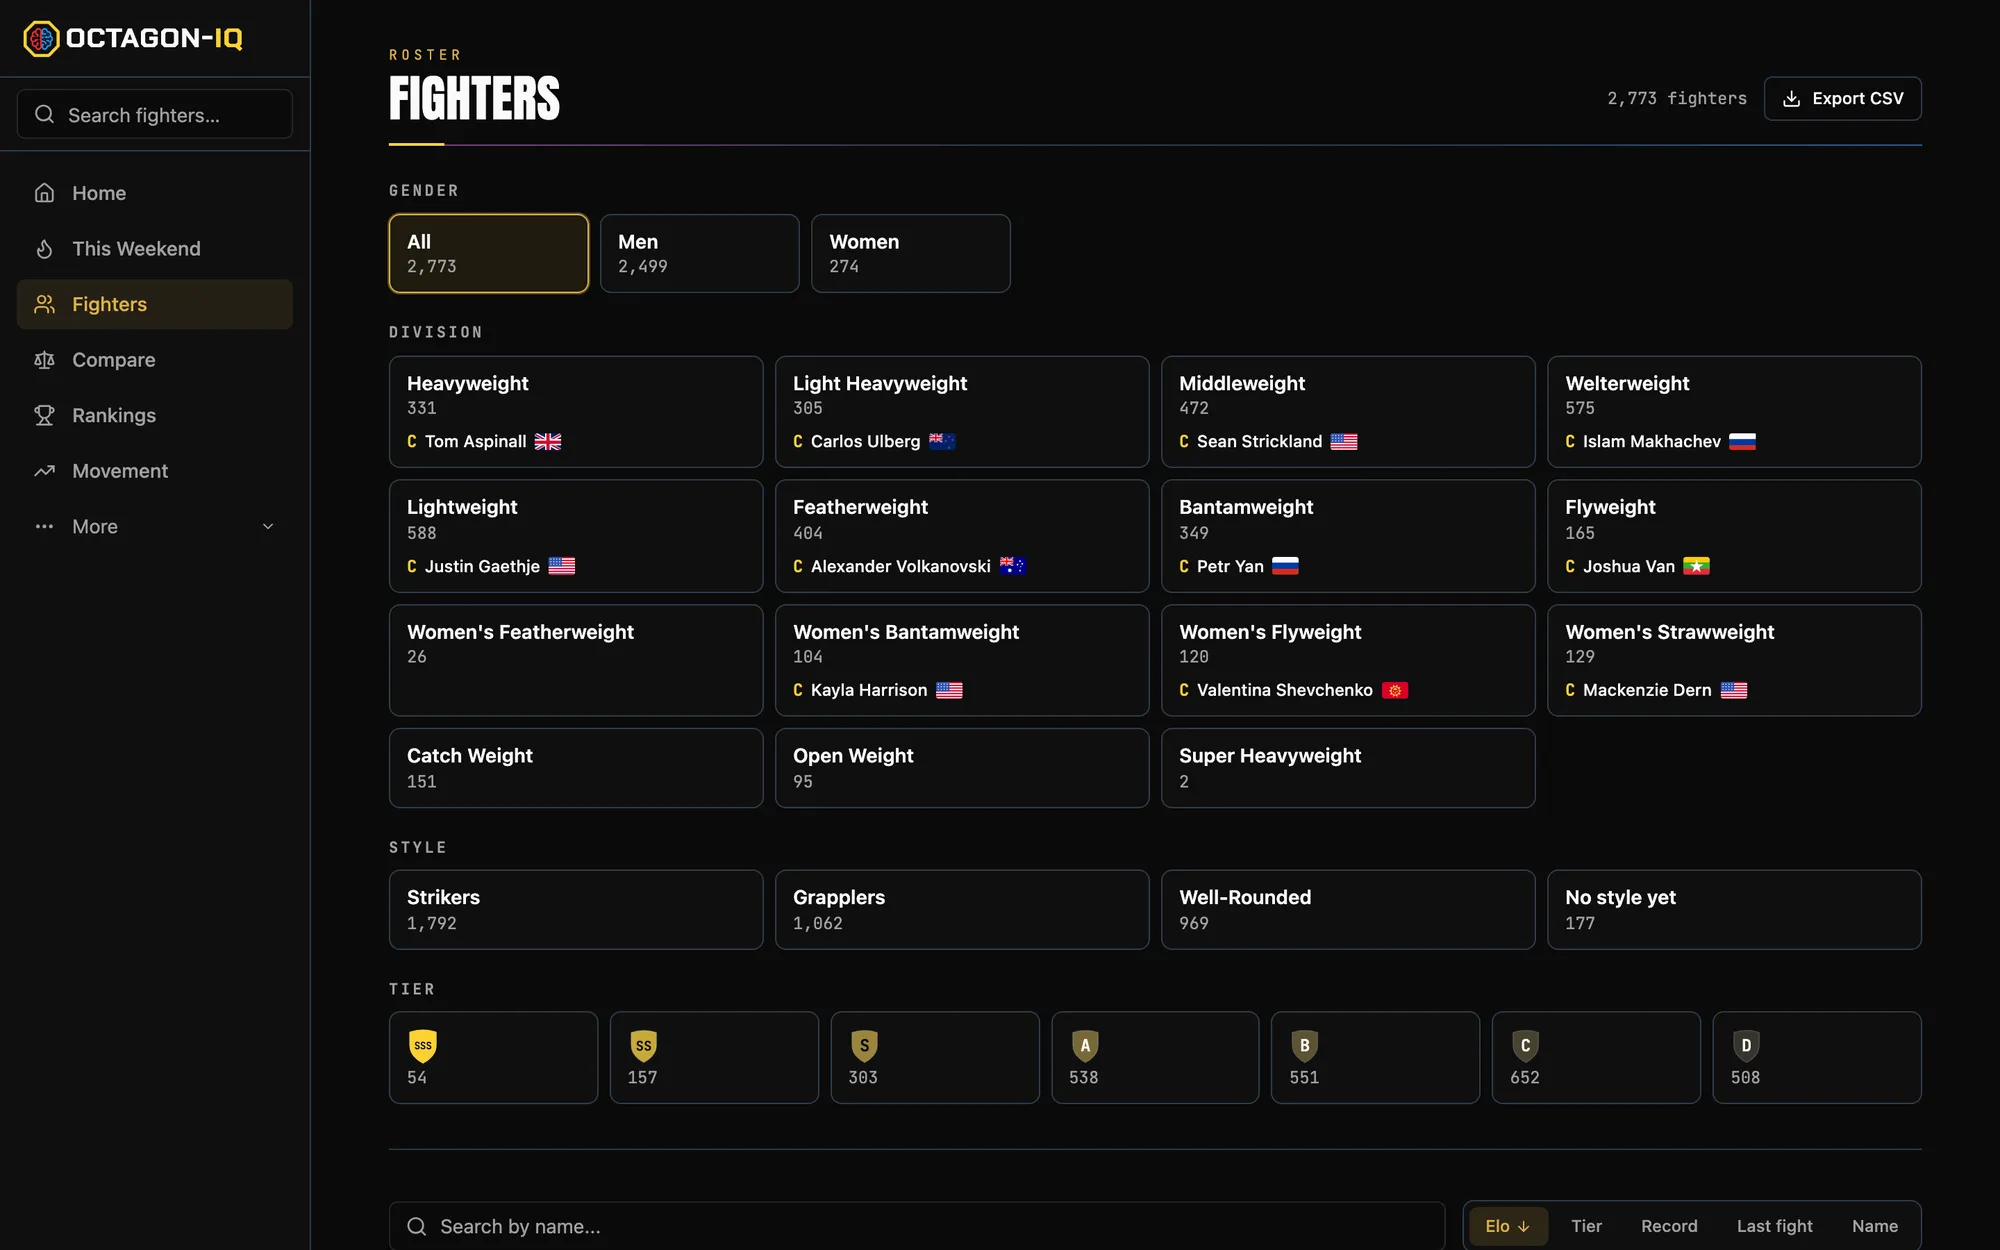
The Fighters page covers all 2,773 fighters. It splits them by gender, division, style and tier, and names the current champion of each division. I left the fighter photos out of this screenshot and the next one.
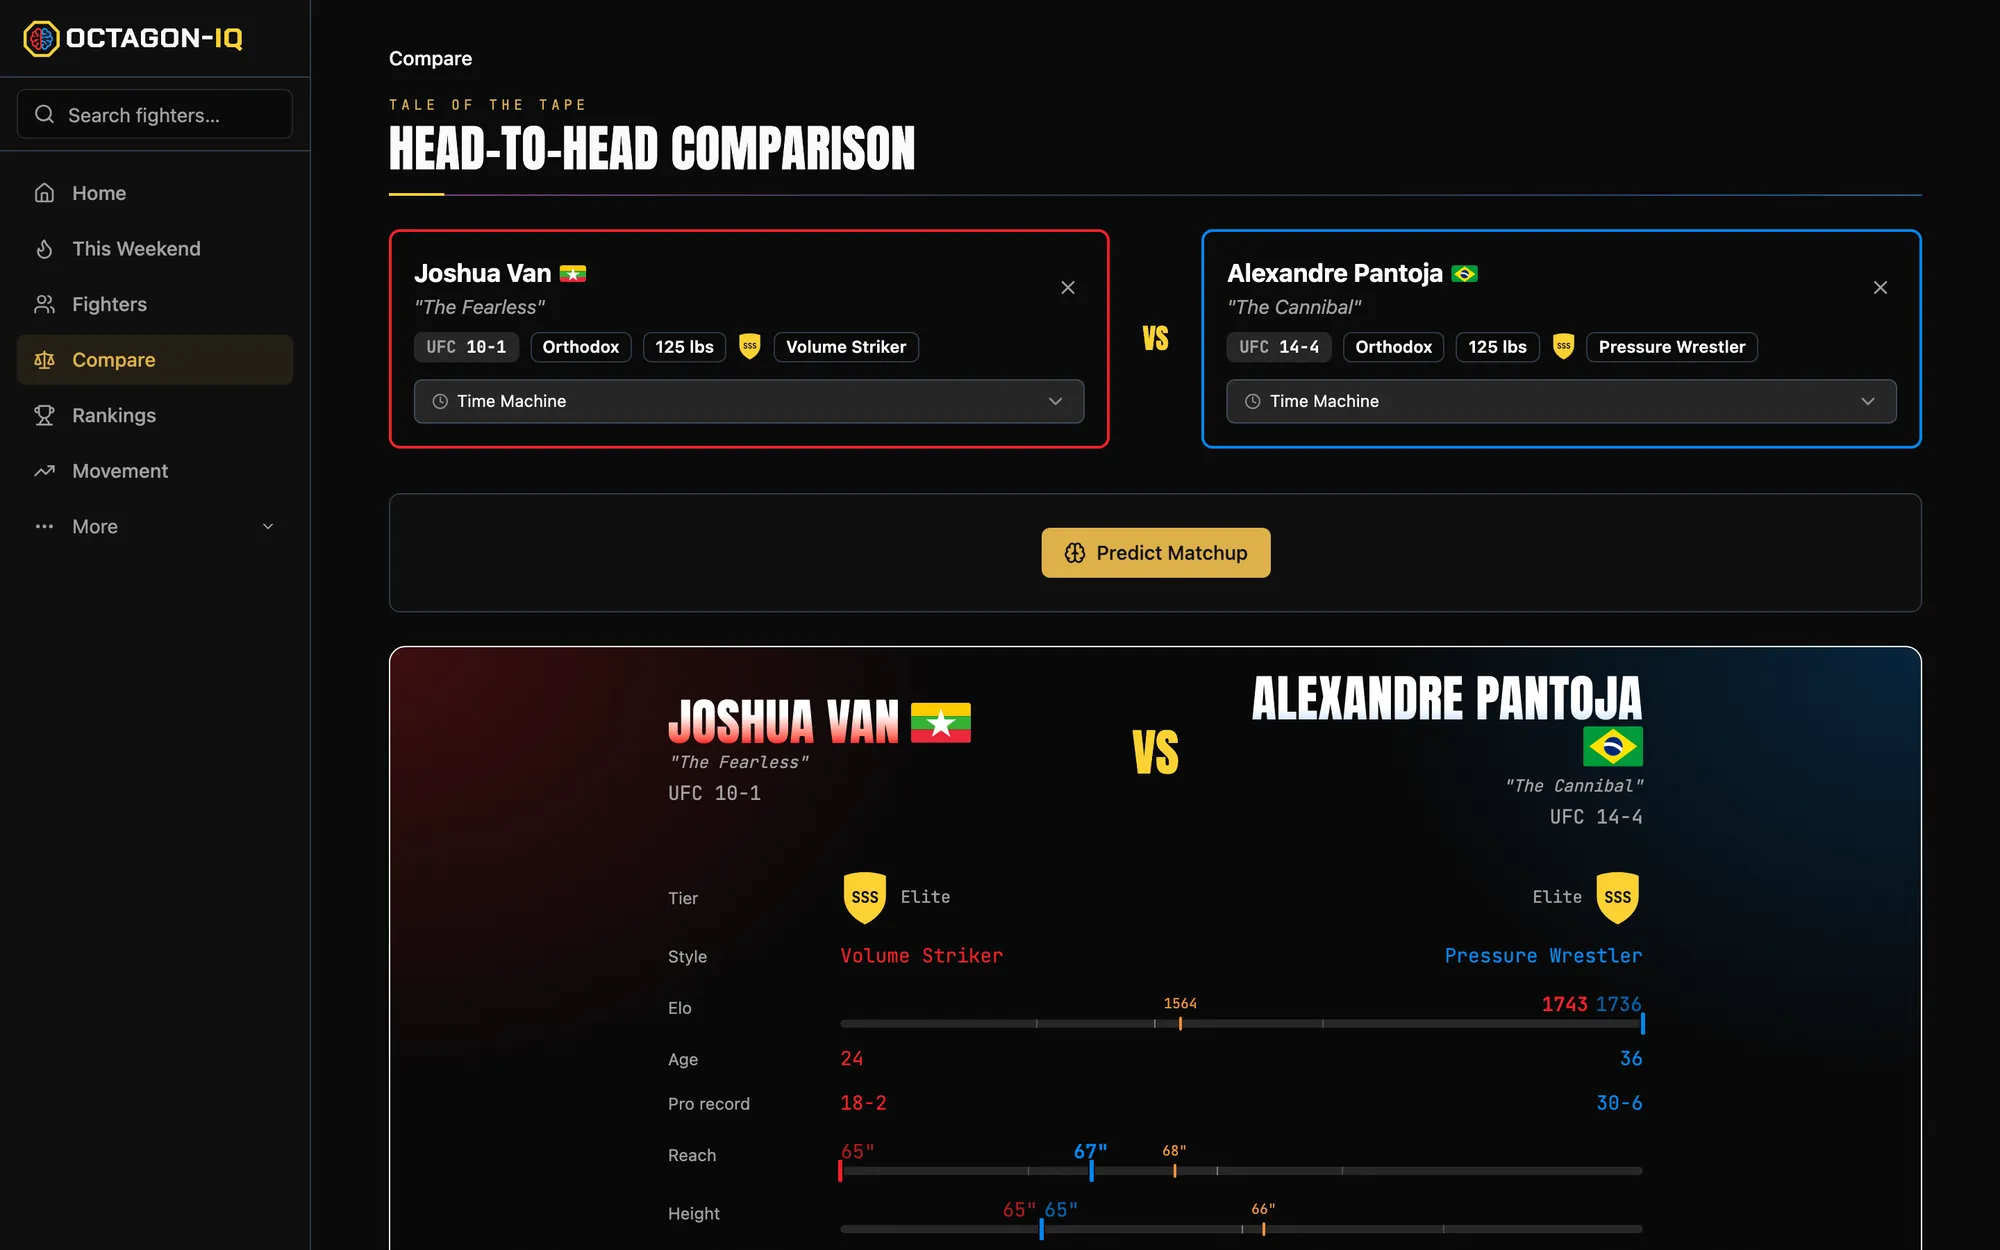
The Compare page puts any two fighters side by side. Here it is set up for the UFC 331 main event.
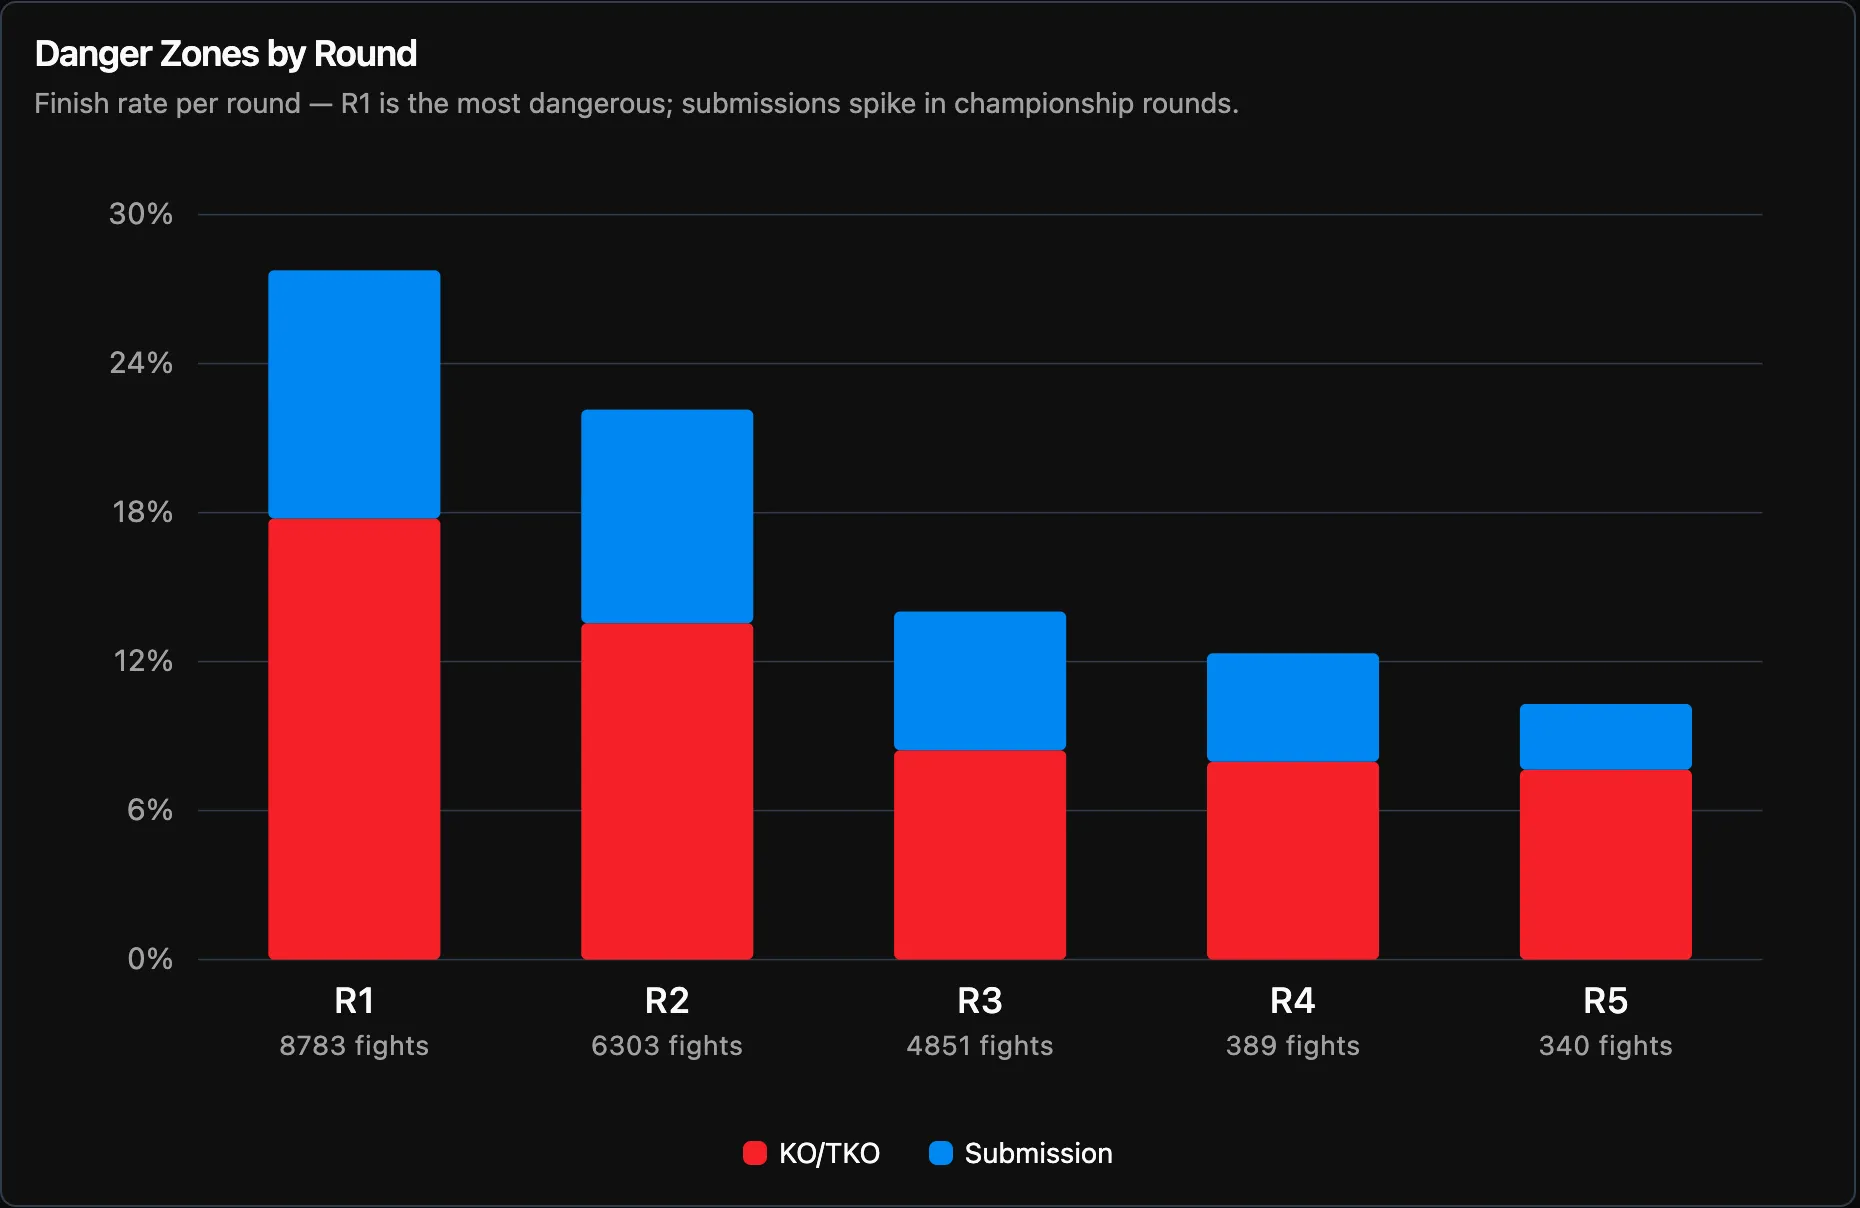
The Lab page holds sport-wide patterns from the same data. This one is the finish rate for each round, split into knockouts and submissions.
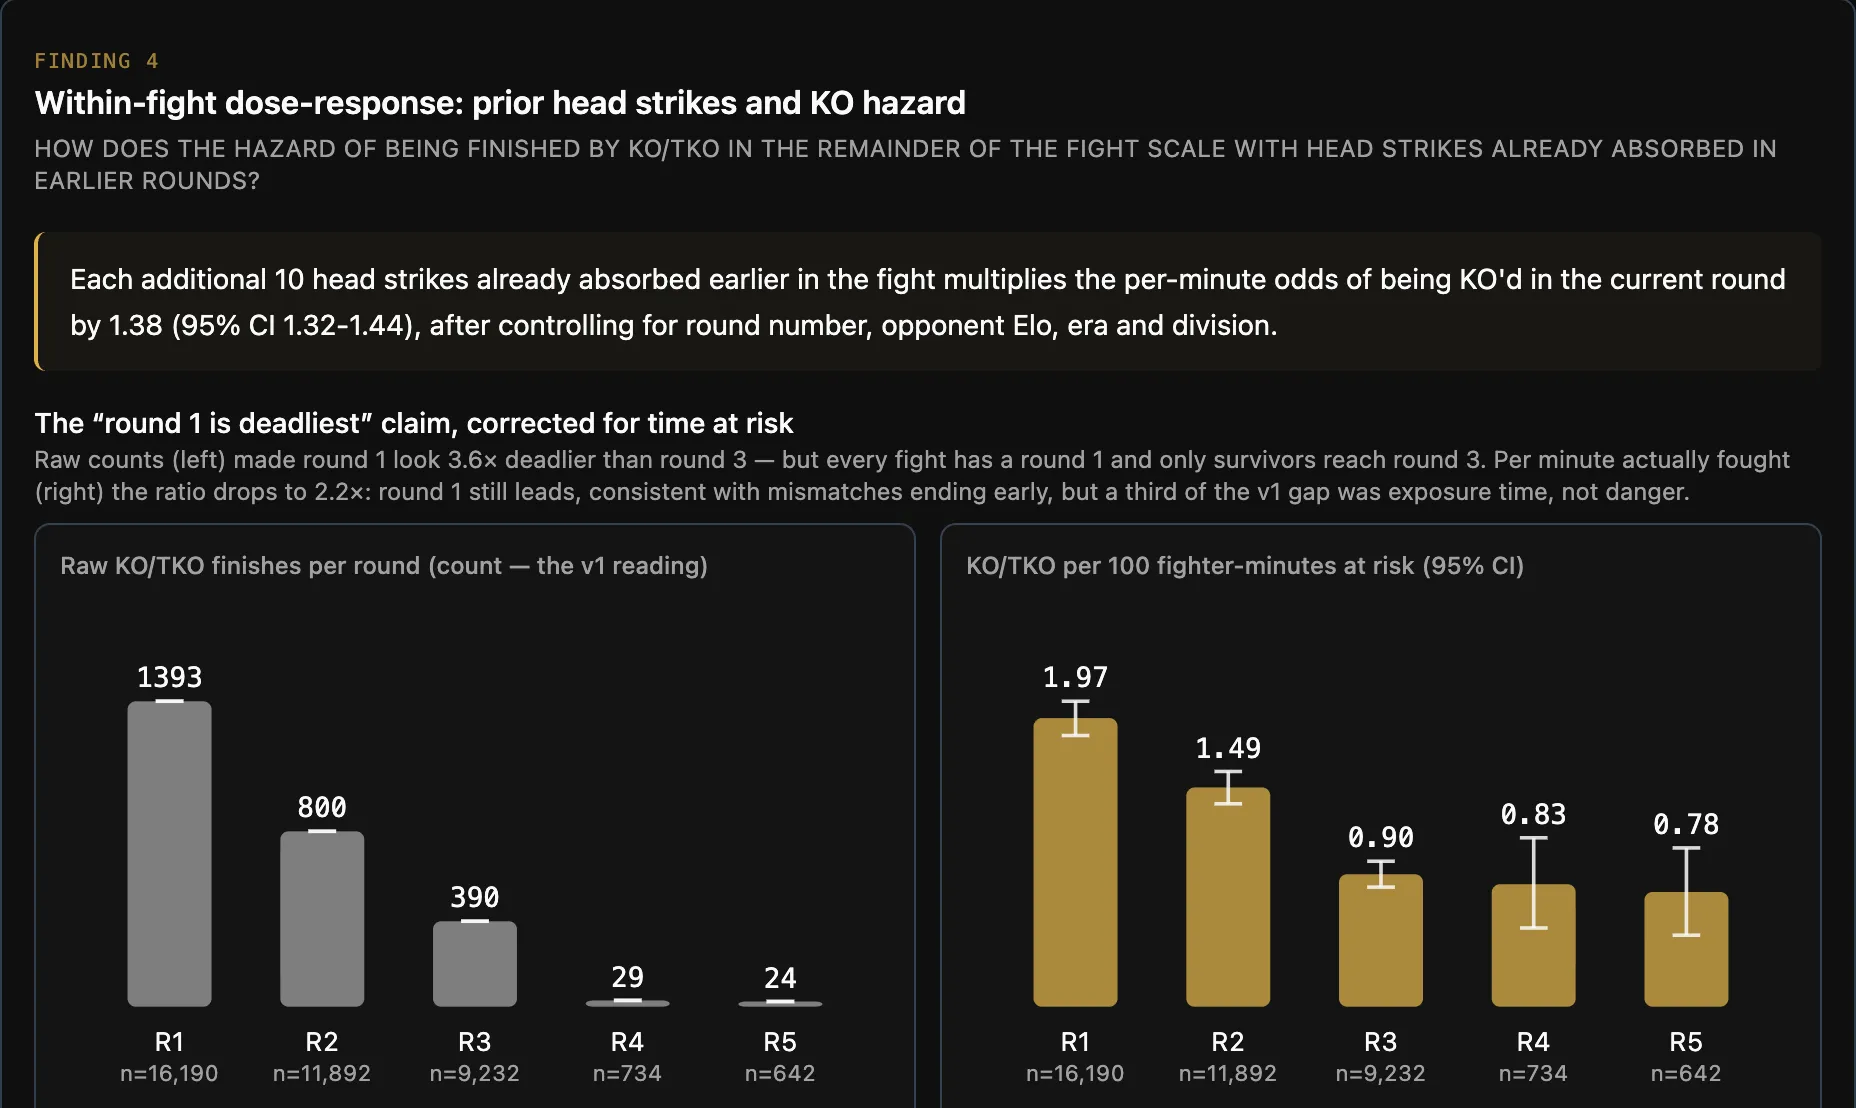
The site also hosts the head trauma study. One of its findings corrects the first version: raw counts made round 1 look 3.6 times deadlier than round 3, but per minute actually fought the gap is 2.2 times.
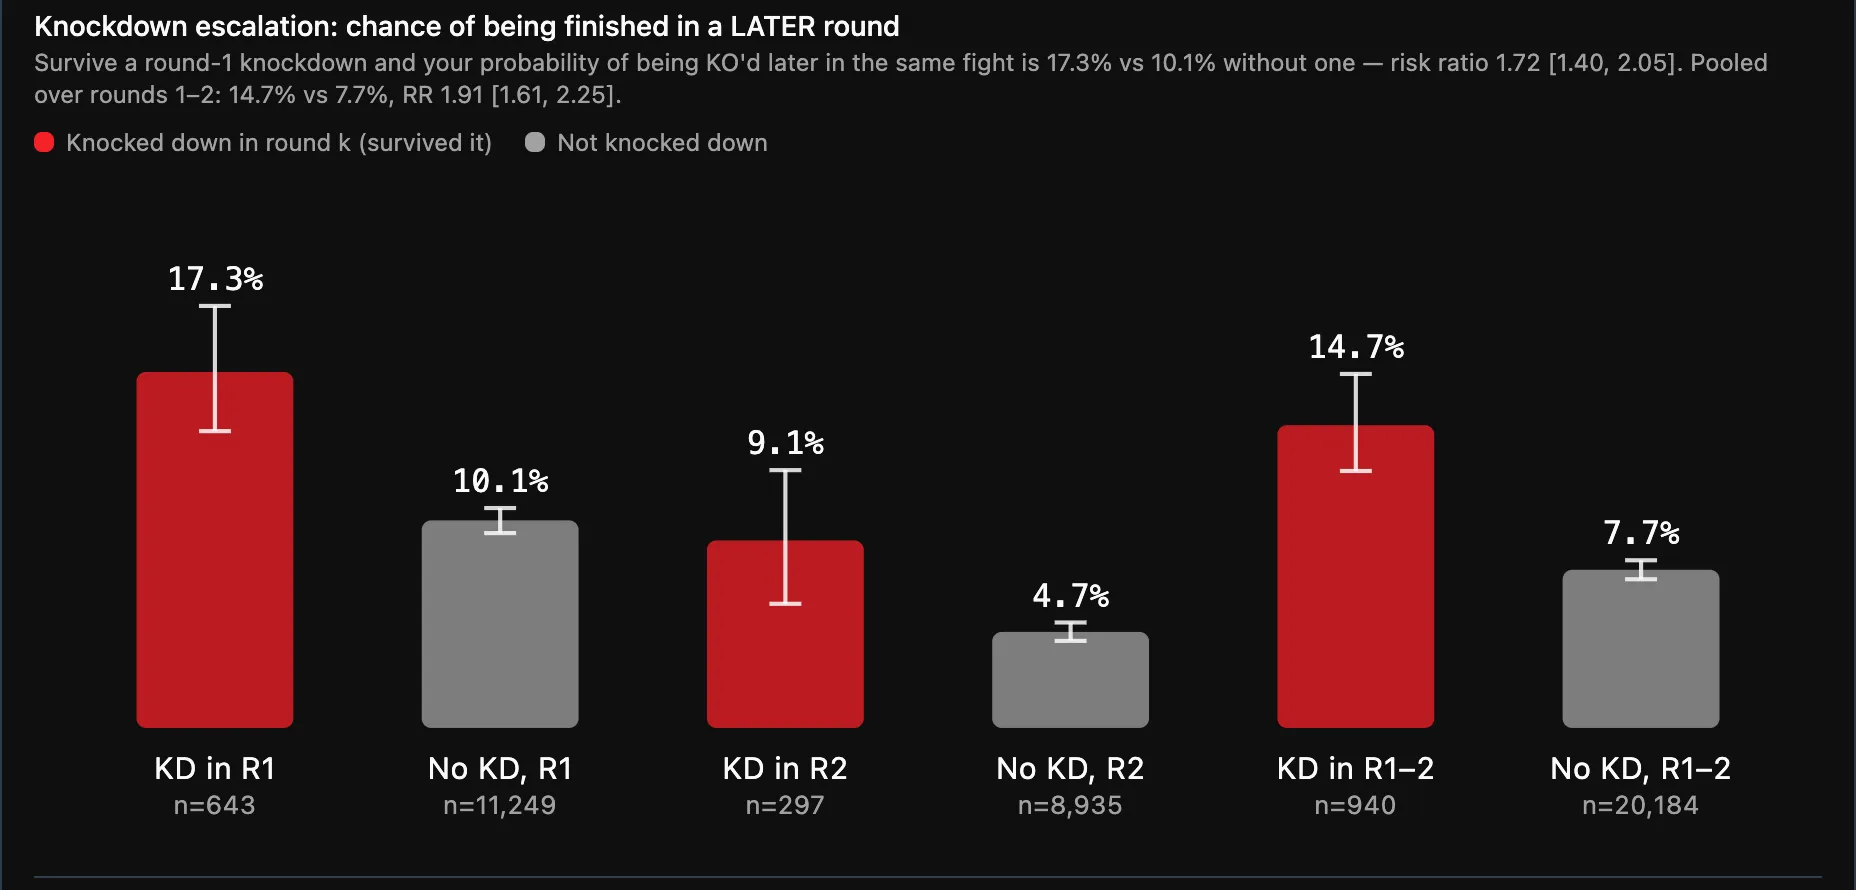
Survive a knockdown in round 1 and the chance of being finished later in the same fight is 17.3%, against 10.1% without one.
The site is live and I am still working on it.
The long version
This section is being written.